User-friendly designed graphical interfaces are the most important tool for power system operators and analysts. WAProtectorTM is based on the latest advanced Internet .NET technologies.
|
| Multi-user Web SCADA |
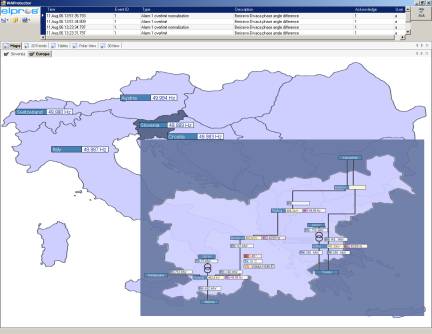
| The visualisation system enables multi-user Web SCADA presentation of: |
- real-time measurements and calculated values,
|
|
- historical database for the last 14 days,
|
|
- event disturbance recordings,
|
- historical data stored on the local user computer.
|
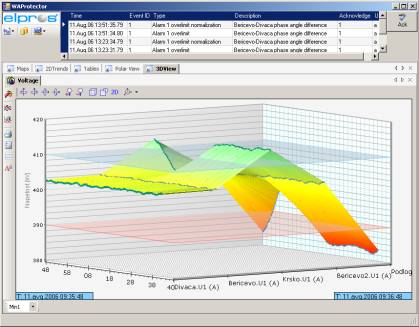
| Flexible displays enable |
|
 |
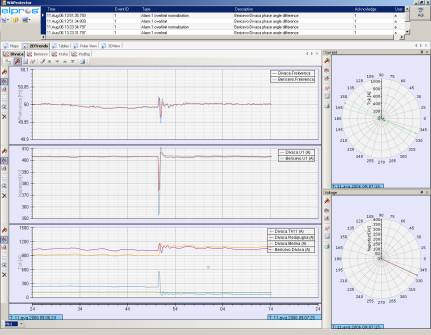
- two and three-dimension time-base curves,
|
- polar coordinate phasor diagrams,
|
 |
|
|
|
| Trending displays allow |
|
- data of different intervals and duration
|
- choice of line colours, markers, gridlines and axes scaling.
|
| Multiple windows |
- Multiple windows based on complete user configuration and adjustment give
operators and engineers the flexibility to create customized visualizations. This way it is possible
to optimise their ability to monitor and analyse the power system.
|
- The visualisation system makes possible allocation of windows on more
monitors that lead to better view of the data.
|
- The system also enables the replay (animation) of historical data.
Functionality to replay different phasors and calculated values provides the user a tracking tool
to better look at overall system behaviour. The user can choose the speed of animation moving between
the data (fast or slow). The replay functionality can be enabled from 2D and 3D plots, polar and bar
diagrams.
|